Understanding Correlation Analysis
Learn how GEOAudit measures the relationship between technical website improvements and brand mention changes to guide your SEO and brand strategy.
Understanding Correlation Analysis
GEOAudit's Correlation Analysis reveals the hidden connections between your technical website improvements and changes in brand visibility across AI platforms. This powerful feature helps you understand which SEO efforts actually drive brand recognition and mentions.
What is Correlation Analysis?
Correlation Analysis measures the statistical relationship between two key metrics:
- Technical Performance Changes - Improvements in your website's technical SEO score
- Brand Visibility Changes - Fluctuations in how often your brand appears in AI responses
The analysis produces a Correlation Strength score from -100% to +100%:
- +70% to +100%: Strong positive correlation (technical improvements drive brand visibility)
- +30% to +69%: Moderate positive correlation (some relationship exists)
- +1% to +29%: Weak positive correlation (minimal relationship)
- 0%: No correlation (changes happen independently)
- -1% to -29%: Weak negative correlation (unusual but possible)
- -30% to -69%: Moderate negative correlation (may indicate external factors)
- -70% to -100%: Strong negative correlation (rare, suggests market disruption)
How Correlation Analysis Works
The 4-Factor Assessment
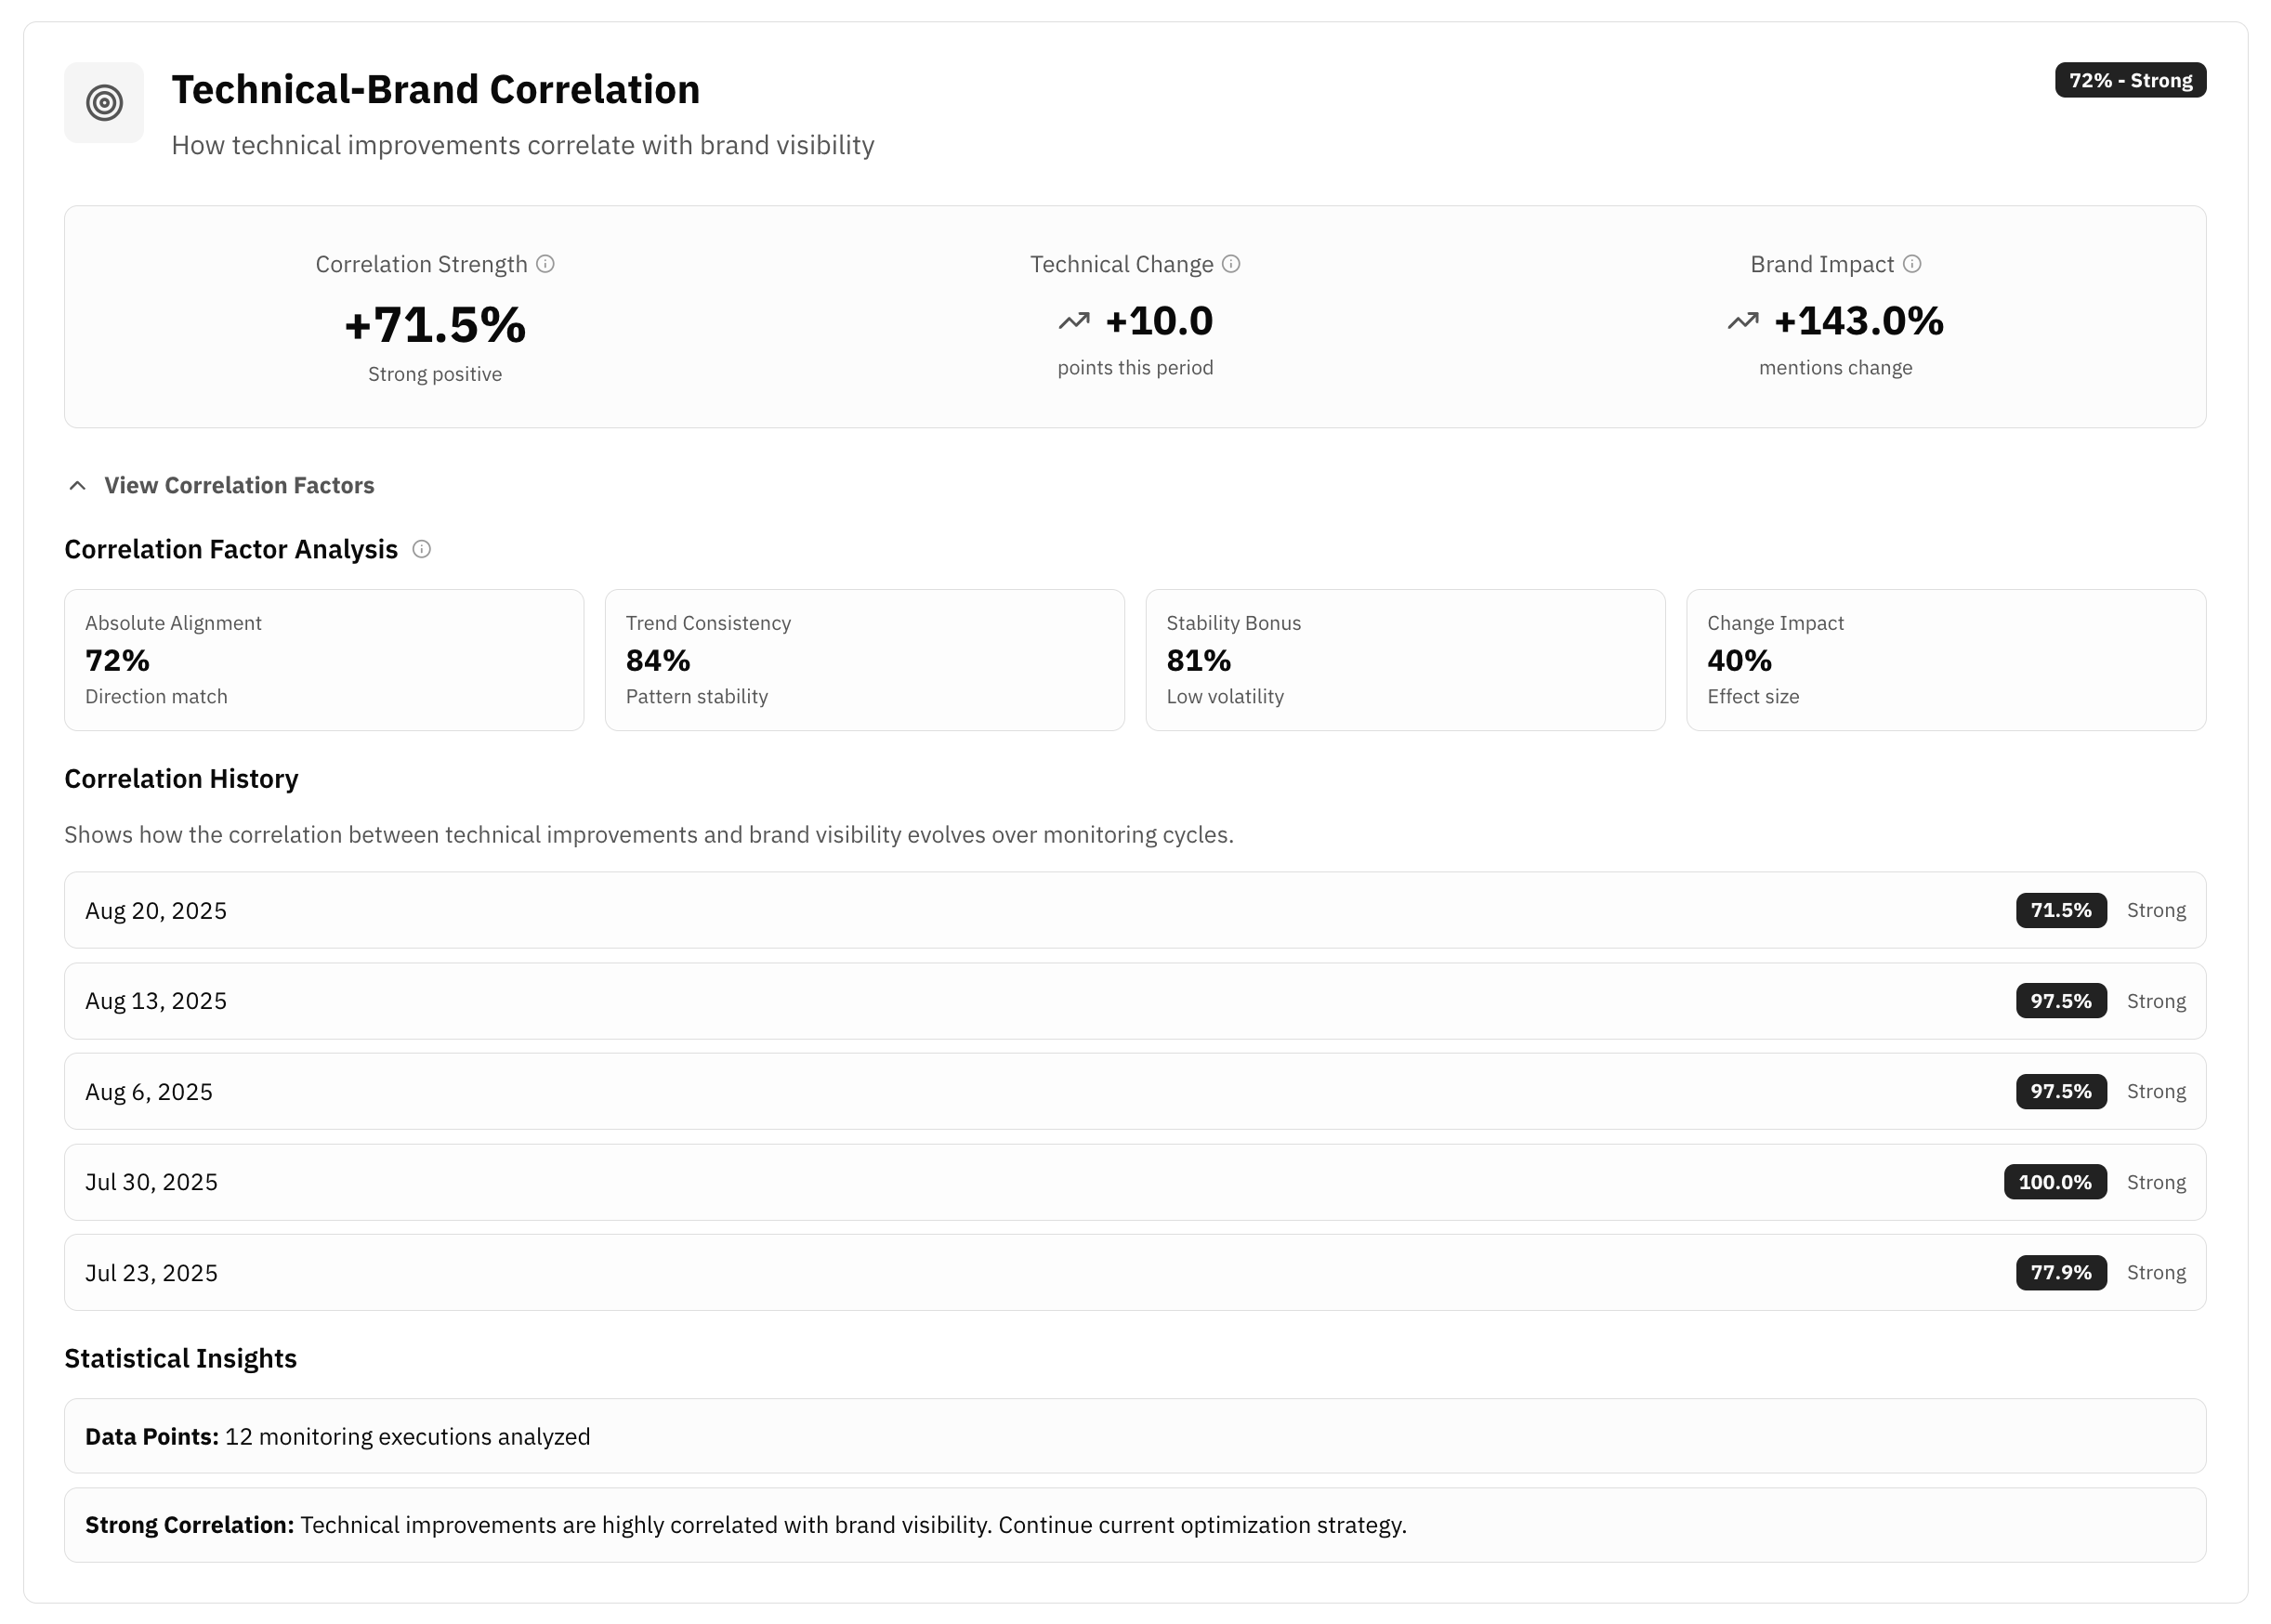
GEOAudit evaluates correlation strength using four sophisticated factors:
1. Absolute Alignment (40% weight)
Measures how well your current technical score predicts your current brand visibility. Higher technical scores should correlate with better brand visibility across AI platforms.
2. Trend Consistency (30% weight)
Analyzes whether technical improvements consistently lead to brand visibility increases over multiple monitoring cycles. This factor rewards predictable, reliable relationships.
3. Stability Bonus (20% weight)
Provides extra weight when both technical performance and brand visibility remain consistently high, indicating a mature, well-optimized presence.
4. Change Impact (10% weight)
Measures how significantly recent technical changes affected the correlation relationship, helping identify which improvements have the strongest immediate impact.
Data Collection Process
The correlation analysis requires:
- Multiple monitoring cycles (minimum 3-4 weeks for meaningful results)
- Technical audit data from both manual and automated audits
- Brand mention tracking across AI platforms and search engines
- Historical comparison points to identify trends and patterns
Key Metrics Explained
Correlation Strength Score
This is your primary metric, displayed prominently in your monitoring dashboard. It tells you:
- How reliably technical improvements translate to brand visibility
- Whether your SEO efforts are having the intended brand impact
- If external factors might be influencing your brand mentions
Technical Score Change
Shows the point change in your overall technical audit score compared to the previous monitoring period. This includes improvements in:
- Robots.txt optimization
- Structured data implementation
- Smart link analysis
- Content protection measures
- LLMs.txt configuration
- E-A-T (Expertise, Authoritativeness, Trustworthiness) factors
Brand Impact Percentage
Displays the percentage change in brand mentions and visibility across monitored AI platforms. This metric helps you understand:
- Whether your brand is gaining or losing visibility
- The magnitude of brand mention changes
- How quickly changes in technical performance affect brand recognition
Interpreting Your Results
Strong Positive Correlation (70%+)
What it means: Your technical SEO improvements are consistently driving increased brand visibility.
Action items:
- Continue your current optimization strategy
- Prioritize technical improvements that have shown the strongest correlation
- Consider increasing the frequency of technical audits
- Document successful strategies for replication
Example interpretation: "Every 10-point improvement in technical score correlates with a 15% increase in brand mentions."
Moderate Positive Correlation (30-69%)
What it means: There's a meaningful relationship between technical improvements and brand visibility, but other factors may also be influencing results.
Action items:
- Focus on high-impact technical areas identified in your audits
- Monitor competitor activity that might be affecting your brand visibility
- Consider expanding your technical optimization scope
- Look for external factors that might be dampening the correlation
Weak or No Correlation (0-29%)
What it means: Limited relationship exists between technical changes and brand mentions, or you need more data to establish patterns.
Possible reasons:
- Insufficient historical data (need more monitoring cycles)
- External market factors overshadowing technical improvements
- Technical changes haven't had enough time to impact brand visibility
- Focus needed on different technical areas
Action items:
- Allow more time for data collection (6-12 weeks minimum)
- Review and broaden your technical improvement strategy
- Analyze competitor landscape for market disruptions
- Consider investigating brand-specific factors beyond technical SEO
Real-World Benefits
For Marketing Managers
- Budget justification: Demonstrate ROI of technical SEO investments
- Strategy alignment: Ensure technical and brand teams work toward common goals
- Performance tracking: Monitor long-term brand building effectiveness
- Competitive advantage: Identify technical optimizations that drive brand recognition
For SEO Professionals
- Priority setting: Focus on technical improvements with proven brand impact
- Client reporting: Show concrete business value of technical work
- Strategy refinement: Adjust technical priorities based on correlation insights
- Risk management: Identify when technical changes might negatively impact brand visibility
For Business Owners
- Investment decisions: Understand which SEO activities drive brand awareness
- Market positioning: Track how technical improvements affect brand perception
- Growth planning: Predict brand visibility outcomes from technical investments
- Competitive intelligence: Compare your correlation patterns with industry trends
Usage Scenarios
Scenario 1: Launching New Technical Improvements
Use case: You've implemented major structured data improvements and want to measure their brand impact.
How to use correlation analysis:
- Establish baseline measurements before implementation
- Monitor for 4-6 weeks post-implementation
- Analyze correlation strength changes
- Identify specific technical areas driving brand visibility gains
Scenario 2: Budget Planning for SEO
Use case: You need to justify continued investment in technical SEO versus other marketing channels.
How to use correlation analysis:
- Review historical correlation trends
- Calculate average brand visibility lift per technical score point
- Project future brand impact from planned technical improvements
- Compare correlation strength with other marketing channel performance
Scenario 3: Competitive Response Strategy
Use case: Competitors are gaining brand visibility, and you need to respond strategically.
How to use correlation analysis:
- Identify which technical factors have strongest historical correlation
- Prioritize improvements in high-correlation areas
- Monitor correlation strength changes after implementing competitive responses
- Adjust strategy based on correlation feedback
Scenario 4: Long-term Brand Building
Use case: Building sustainable brand recognition through technical excellence.
How to use correlation analysis:
- Track correlation consistency over 6+ months
- Identify technical maintenance areas that preserve correlation strength
- Plan proactive technical improvements to maintain positive correlation
- Use correlation trends to predict future brand visibility requirements
Best Practices for Maximum Value
1. Allow Sufficient Data Collection Time
- Minimum 4 weeks of monitoring data before drawing conclusions
- 6-12 weeks for reliable correlation patterns
- 3+ months for strategic decision-making based on correlation trends
2. Consider External Factors
- Market seasonality affecting brand mention patterns
- Competitor activity that might influence your brand visibility
- Industry trends that could impact correlation relationships
- Algorithm changes in AI platforms affecting mention patterns
3. Focus on Actionable Insights
- Identify specific technical areas with strongest positive correlation
- Prioritize improvements based on historical correlation impact
- Document successful strategies that maintain strong correlation
- Avoid over-optimizing based on short-term correlation fluctuations
4. Combine with Other Metrics
- Use correlation analysis alongside traditional SEO metrics
- Consider brand sentiment alongside mention volume
- Monitor competitor correlation patterns for market context
- Track correlation changes relative to technical audit frequency
Troubleshooting Common Issues
Low Correlation Despite Technical Improvements
Possible causes:
- Technical changes need more time to impact brand visibility
- External factors are overshadowing technical improvements
- Technical improvements aren't in areas that affect brand recognition
- Competition is increasing faster than your improvements
Solutions:
- Extend monitoring period for more comprehensive data
- Analyze competitor activity and market conditions
- Focus on technical areas most visible to AI platforms
- Consider increasing pace of technical improvements
Inconsistent Correlation Patterns
Possible causes:
- Seasonal variations in brand mention patterns
- Irregular technical improvement implementation
- External events affecting brand visibility
- Insufficient historical data for pattern recognition
Solutions:
- Establish regular technical improvement schedules
- Account for seasonal trends in analysis
- Document external events that might affect correlation
- Increase monitoring frequency for better pattern detection
Negative Correlation Results
Possible causes:
- Market disruption affecting industry brand patterns
- Technical changes coinciding with negative external events
- Competitor actions overwhelming your improvements
- Platform algorithm changes affecting mention patterns
Solutions:
- Analyze market conditions and competitor activity
- Review technical changes for unintended consequences
- Extend analysis period to identify if negative correlation is temporary
- Consider broader technical improvement strategy
Advanced Correlation Insights
Significant Changes Detection
The system automatically identifies and reports significant changes that may indicate cause-and-effect relationships:
- Technical improvements above 3-point changes
- Brand mention changes above 8% fluctuations
- Correlation strength shifts that indicate strategy effectiveness
Historical Trend Analysis
Track how correlation strength evolves over time to identify:
- Improvement trajectories showing increasing correlation
- Plateau periods where correlation stabilizes
- Decline patterns that may indicate strategic adjustments needed
- Cyclical variations related to seasonality or market conditions
Factor Breakdown Analysis
Understand which of the four correlation factors contribute most to your results:
- High Absolute Alignment: Strong current relationship between technical and brand metrics
- High Trend Consistency: Reliable patterns over time
- High Stability Bonus: Consistently strong performance
- High Change Impact: Recent improvements showing immediate correlation effects
Getting Started
- Enable Monitoring: Set up brand monitoring for your website through your GEOAudit dashboard
- Complete Initial Audit: Ensure you have baseline technical scores from a comprehensive audit
- Allow Data Collection: Wait 4-6 weeks for meaningful correlation data to develop
- Review Analysis: Access your correlation analysis through the Brand Monitoring section
- Plan Improvements: Use correlation insights to prioritize technical improvements
- Monitor Progress: Track correlation changes as you implement technical optimizations
Next Steps
- Explore Brand Analysis: Learn how correlation analysis integrates with comprehensive brand monitoring
- Review Technical Audit Results: Understand which technical improvements have the strongest correlation potential
- Set Up Competitor Monitoring: Compare your correlation patterns with competitor performance
- Plan Long-term Strategy: Use correlation insights for strategic SEO and brand planning
Correlation Analysis transforms technical SEO from guesswork into data-driven strategy, helping you focus your efforts on improvements that genuinely impact your brand's visibility and recognition in the AI-driven search landscape.